


The Correlation Between Stock and Bonds
The correlation between stocks and bonds (as represented by the S&P 500 Index and the Bloomberg US Aggregate Bond Index) has never been higher, on a 3-year rolling basis, since the inception of the Bloomberg Aggregate Bond Index in 1976, as seen below.
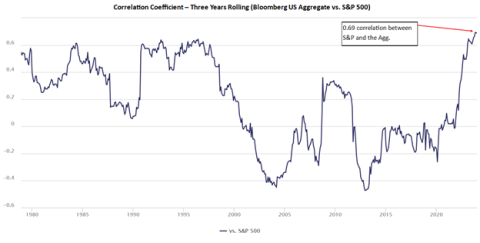
The last two times the correlation between stocks and bonds was near this level was in 1984 and again in the mid-1990s. An interesting parallel of those periods to the current period is that they were each also during a Federal Reserve Interest Rate hiking cycle. Both periods also saw year-over-year CPI increases greater than 3%, which is how high the yearly increase in CPI has been for almost three years in a row now. The combination of high inflation and increasing interest rates often goes hand in hand as the Federal Reserve usually will hike rates to combat rising inflation. That happened in 2022, coinciding with the spike in correlation between stocks and bonds seen shortly after 2020 in the chart above.
The relationship between stocks, bonds, and the CPI has been interesting over the last 50 years or so. In the 577 months since 1976, 295 saw a year-over-year CPI increase of 3 or more percent. 282 months saw a yearly CPI increase of less than 3%. That’s about as close to 50/50 as one can get over a long sample period. So, about half the time, CPI is running over 3%, and the other half, it’s running under 3%. This may not seem consequential, except how the relationship between stocks and bonds changes in each of those separate inflation regimes. When inflation is held in check (under 3%), stocks and bonds display the type of correlation one might expect them to; that is, they have a very low correlation to each other in those months: only about 2%. This kind of correlation is what most of us are used to; stocks and bonds display differentiated return streams and can be used together in investment portfolios to increase diversification.
That’s been the environment for the last 20 years. Low inflation and low correlation between stocks and bonds. Except, of course, for 2022 and 2023. That’s when inflation began to pick up. It was a fallout of the mega stimulus during the COVID-19 pandemic. Then, as seen in the chart, the correlation of stocks and bonds also increased. This is unsurprising based on the other half of the time since 1976 when inflation ran above 3%. The correlation between stocks and bonds jumps to 37% in those months with higher inflation. This is not necessarily a high correlation in normal circumstances. It certainly is not high compared to the current correlation of 69% shown in the chart. However, when compared to the very low correlation seen in the sub-3% CPI periods and when comparing other periods in the chart above where the correlation is in a similar range, 37% becomes a bit more problematic.
When the correlation hovers in the 30-40% range, this has coincided much more with tumultuous economic periods and, often, recessions. The two recessions of the 1980s, the one in the early 1990s, and the Global Financial Crisis in 2007-2008 would be included in these periods. In the current environment, we have avoided recession in the fallout of COVID-19. However, the longer inflation stays above the 3% threshold, the harder it will be to avoid as time goes on.
This brings the inflation print today to the forefront. Now that we have another month above a 3% year-over-year increase in the CPI, we are heading towards the correlation profile between stocks and bonds remaining elevated. This will continue to make it difficult for advisors to appropriately diversify their client portfolios as the traditional 60/40 stock/bond portfolio has struggled in these higher inflationary periods. It may be prudent to consider other alternatives for diversifying portfolios, such as precious metals or other real asset strategies.