


Photo courtesy of pikwizard.com
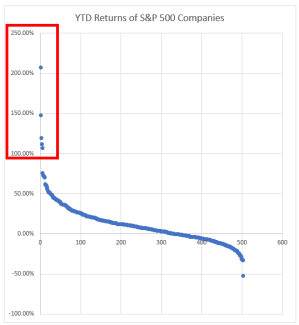
How Market Breadth Affects Stock Market Performance
Market breadth measures the ratio of stocks within an index that are advancing in price and how much they are advancing in price vs. the number of stocks in an index
that are either declining in price or gaining less than the best performing stocks. It is a form of attribution analysis done to research and pinpoint which stocks within an index are supplying a majority of returns. In the case of the S&P 500 over the last 8 months or so, market breadth has been quite poor. The large run up we have seen since October 2022 and over the first 6 months of the year (16.9% YTD return as of 6/30/2023 per eVestment.com) has been powered mostly by the 5-10 largest holdings within the index.
As you can see from the chart to left, there are 5 clear stocks highlighted that have provided outlier returns far and away above the rest of the index so far in 2023 (data from barchart.com).
In fact, if you removed the returns from these 5 stocks from the index, the performance of the S&P 500 would be about 10% less through the first six months of 2023. To put it another way, 1% of the stocks in the index have provided over 50% of the return through the first half of the year. This level of concentration at the top of the market is quite rare and usually not a good sign. Some examples of this can be seen below from our good friends at JP Morgan Asset Management.
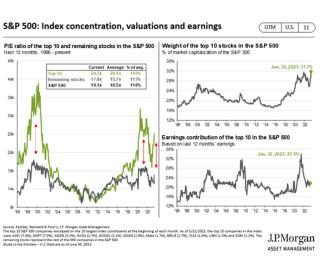
The chart on the left shows the average P/E ratios of the top 10 stocks in the S&P 500 Index plotted with the average P/E ratios of the remaining 490 stocks in the index. There has not been a gap this large between the top 10 and the rest of the index since the tech bubble of the late 90’s. A recession soon followed, after the tech bubble burst in the early 2000’s. Another indication of the abnormally high level of concentration in the S&P 500 can be seen in the smaller graphs on the right as well, most notably in the top right chart. As of June 30, 2023, the top 10 stocks in the S&P hold the highest weighting within the index since 1996. Even during the years of the tech bubble, the index was not as concentrated as it is now.
This level of concentration and poor breadth isn’t necessarily a bad thing in the short-term…if those select few stocks continue to perform well. However, it is also possible that the poor market breadth may be turning around. In June, the equal weighted S&P 500 index outperformed the traditional market cap weighted S&P 500. This is only the second month that the equal weight version of the S&P 500 outperformed the market cap weighted version since September 2022. When the equal weighted S&P outperforms it is a sign of positive market breadth and could be a good signal for equity markets heading into the second half of 2023. Markets do tend to look out 6-9 months into the future, and if market breadth does keep improving, then perhaps the good returns we have seen so far in 2023 could continue in 2024.